Methodology
The GeoStep library is built on the foundation of the Randomised Controlled Trial (RCT), the gold standard for causal inference. This document provides a overview of the experimental designs and statistical concepts that underpin the library.
The Gold Standard: Randomised Controlled Trial (RCT)
An RCT is an experimental design that aims to reduce bias when testing a new intervention. In the context of marketing, the “intervention” is typically an advertising campaign, promotional offer, or other marketing treatment.
Core Principle: Randomization
The fundamental principle is randomization. A population of units (in our case, geographic areas) is randomly assigned to one of two groups:
Treatment Group: This group is exposed to the intervention (e.g., they see the ad campaign)
Control Group: This group is not exposed to the intervention (business as usual)
Because the assignment is random, the only systematic difference between the two groups is the intervention itself. Therefore, any statistically significant difference in the outcome (e.g., sales) between the two groups can be attributed to the intervention.
Why RCTs Matter for Marketing
The Problem with Observational Data:
Correlation ≠ Causation: High-spending customers may see more ads, but ads may not cause the spending
Selection Bias: Campaigns often target specific audiences, confounding the results
Unobserved Confounders: External factors (seasonality, competition) can influence outcomes
The RCT Solution:
Eliminates Selection Bias: Random assignment ensures comparable groups
Controls for Confounders: Both known and unknown factors are balanced
Measures True Incrementality: Isolates the causal effect of marketing
Advanced Designs
The Stepped-Wedge Trial (SWT)
The SWT is an alternative to the classic parallel-arm RCT. In an SWT, all clusters begin in the control condition. Over time, groups (or “steps”) of clusters are randomly assigned to switch over to the treatment condition. This continues until all clusters are in the treatment group.
Advantages for Marketing:
Logistically Practical: Allows for a phased rollout of a campaign, which is often more feasible than a “big bang” launch
Statistically Powerful: Because every cluster is observed in both states, it serves as its own control
Ethically Favorable: Eventually all units receive the treatment (important for beneficial interventions)
The Staircase Design
The Staircase design is a more pragmatic and efficient variation of the SWT, formally described by Grantham et al. (2024).
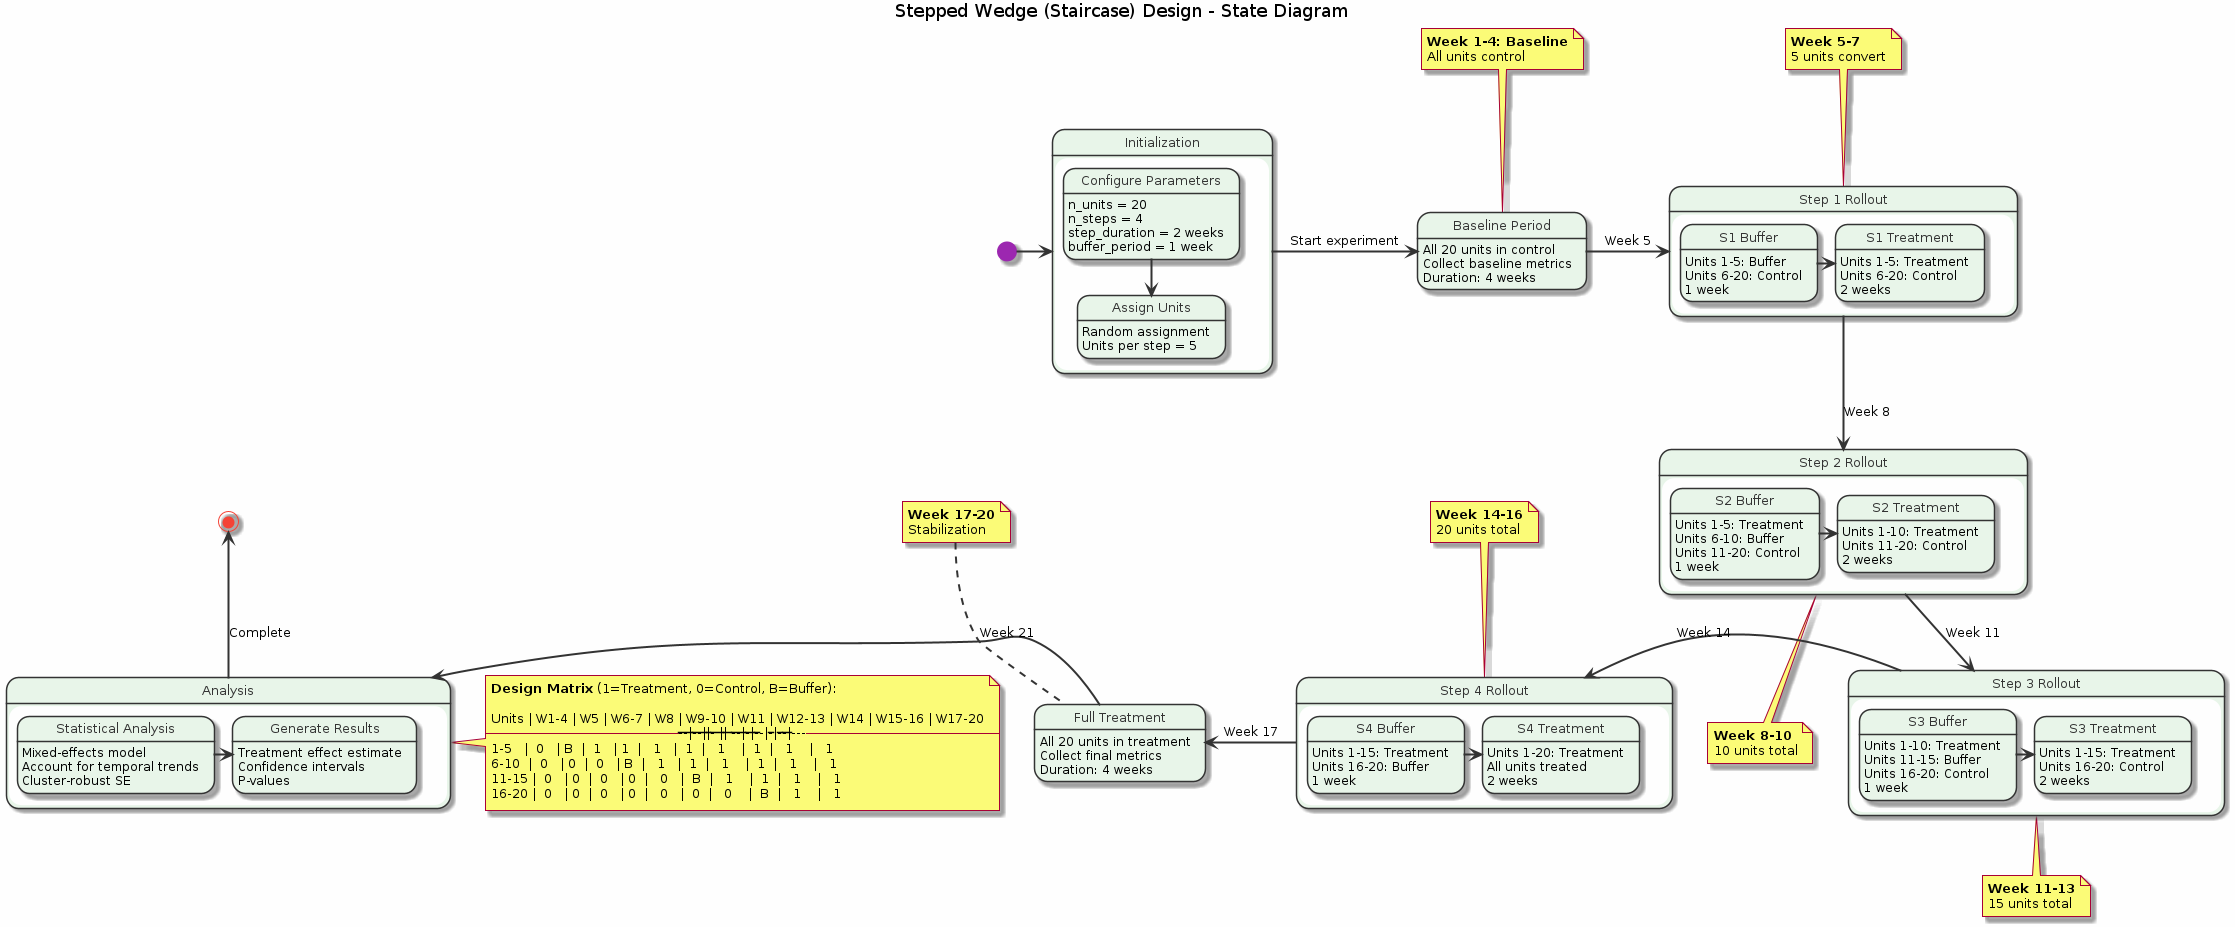 Figure: State diagram showing the progression of a staircase experiment from initialization through baseline period, stepped treatment rollout, and final analysis. Each state represents a distinct phase with specific data collection requirements.
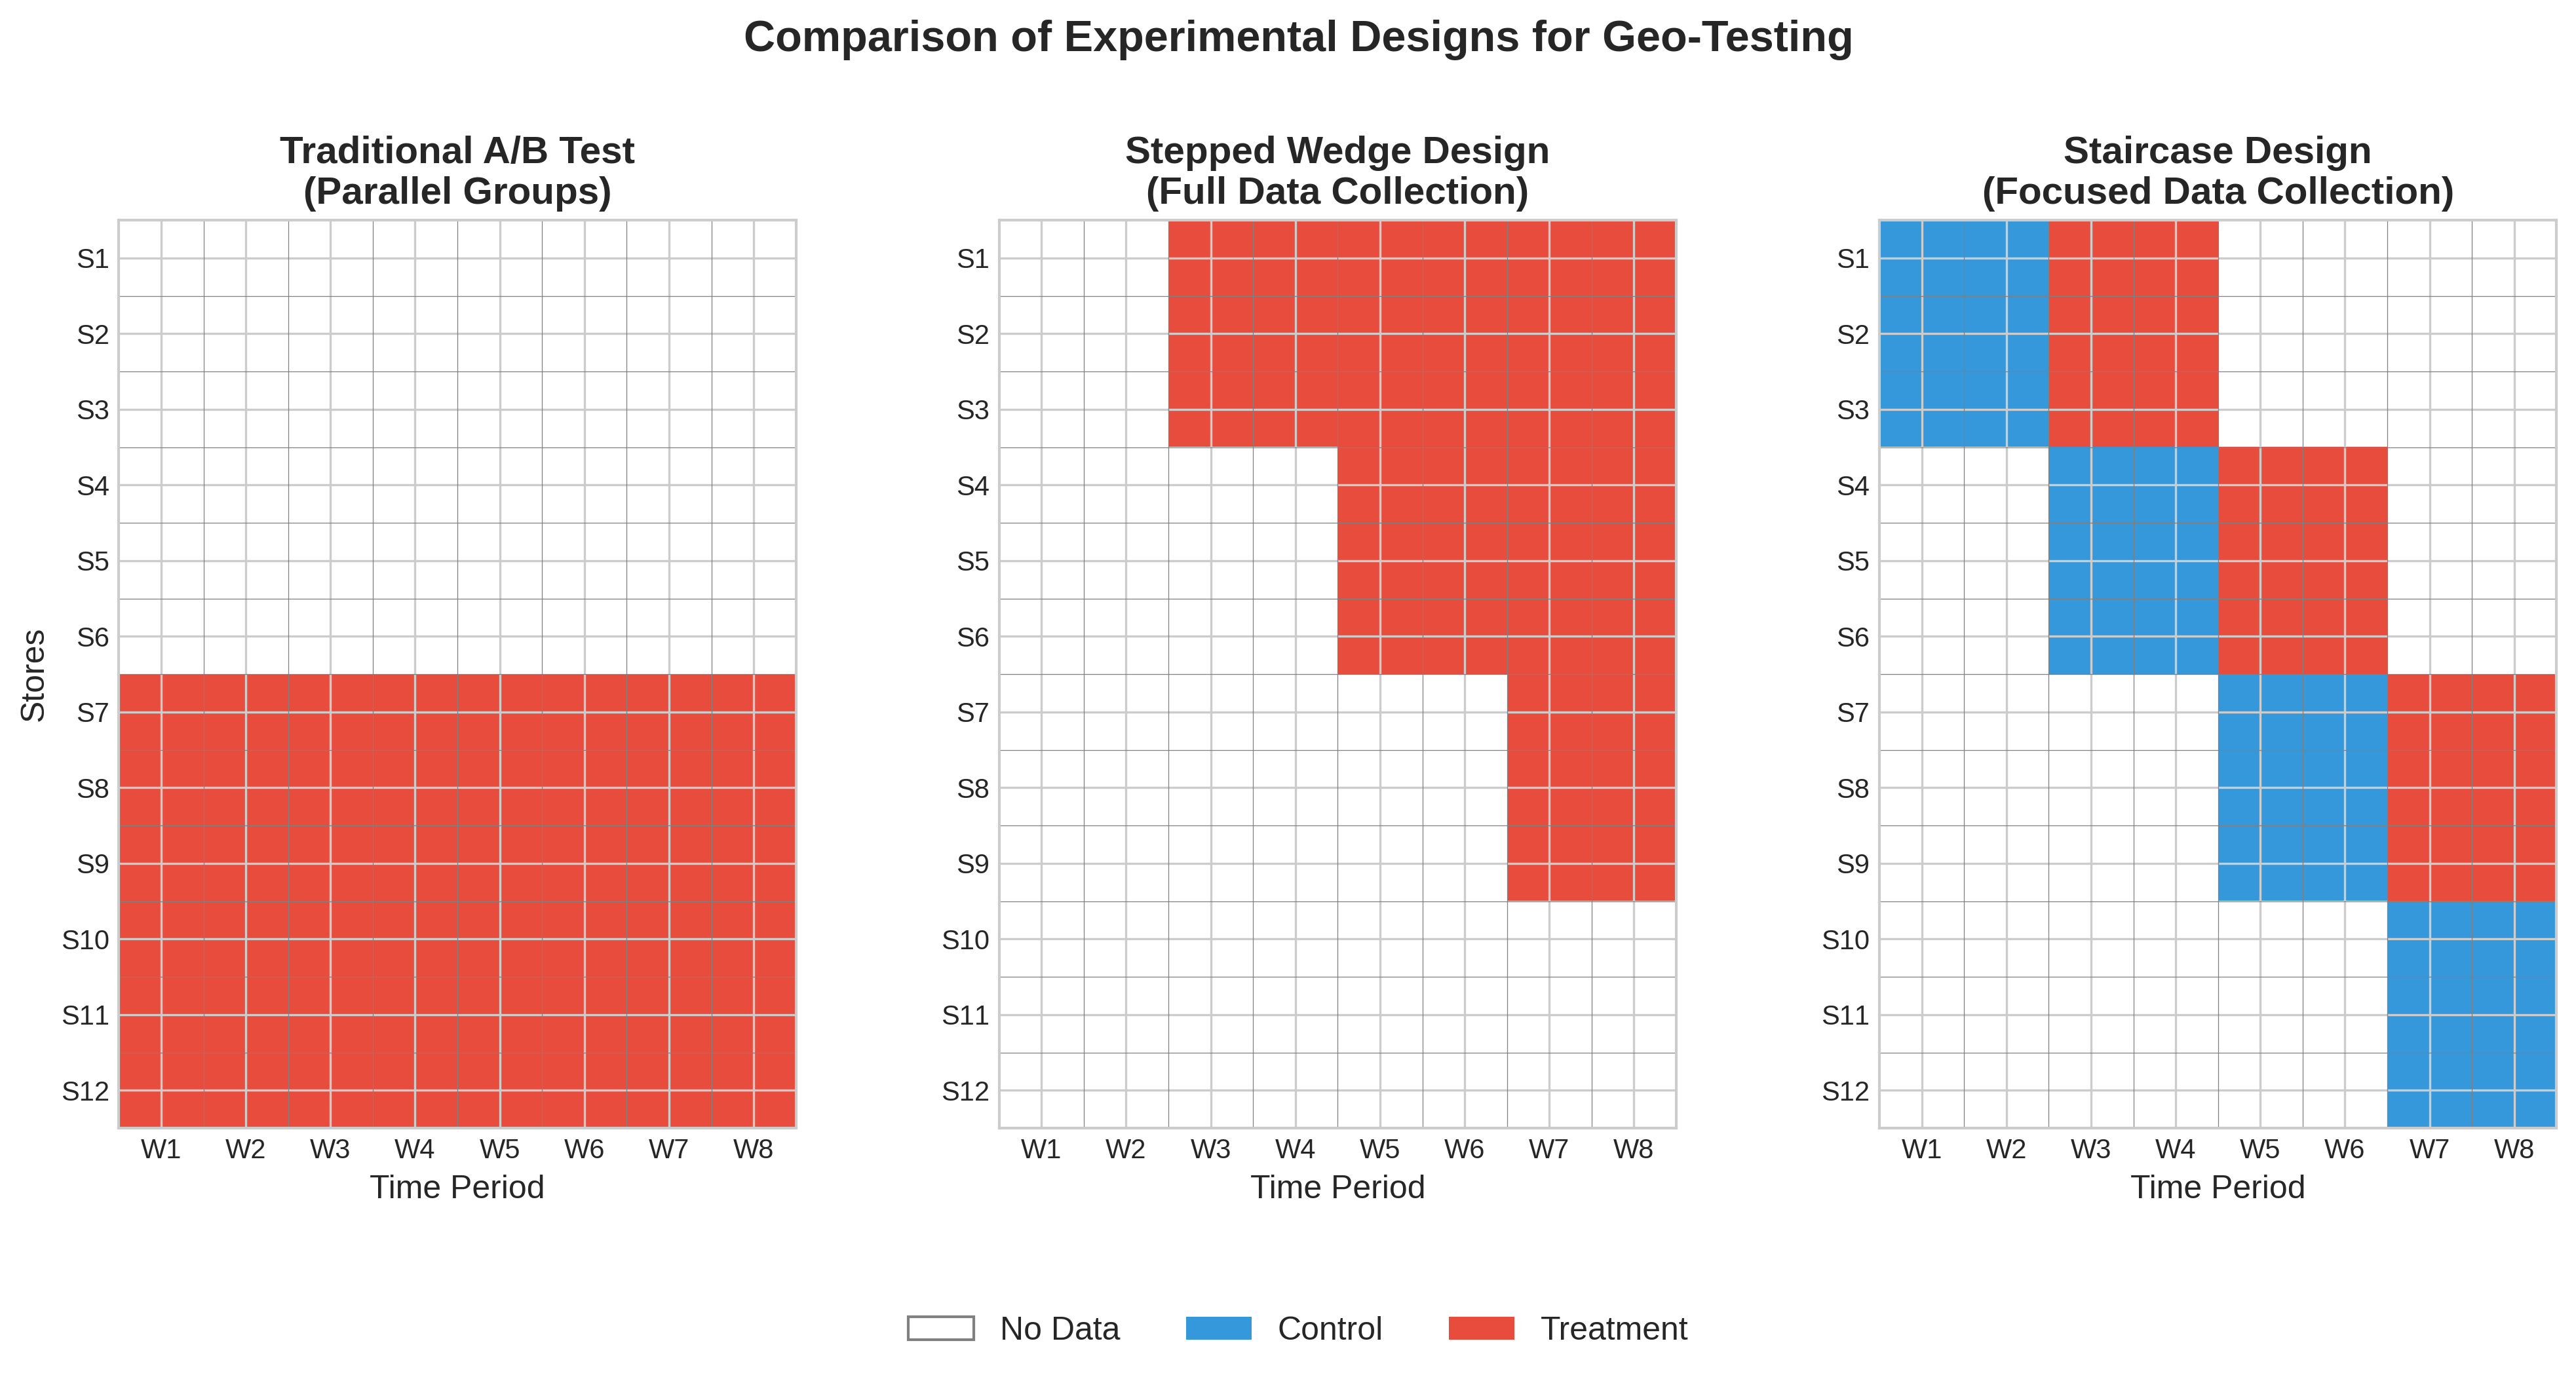
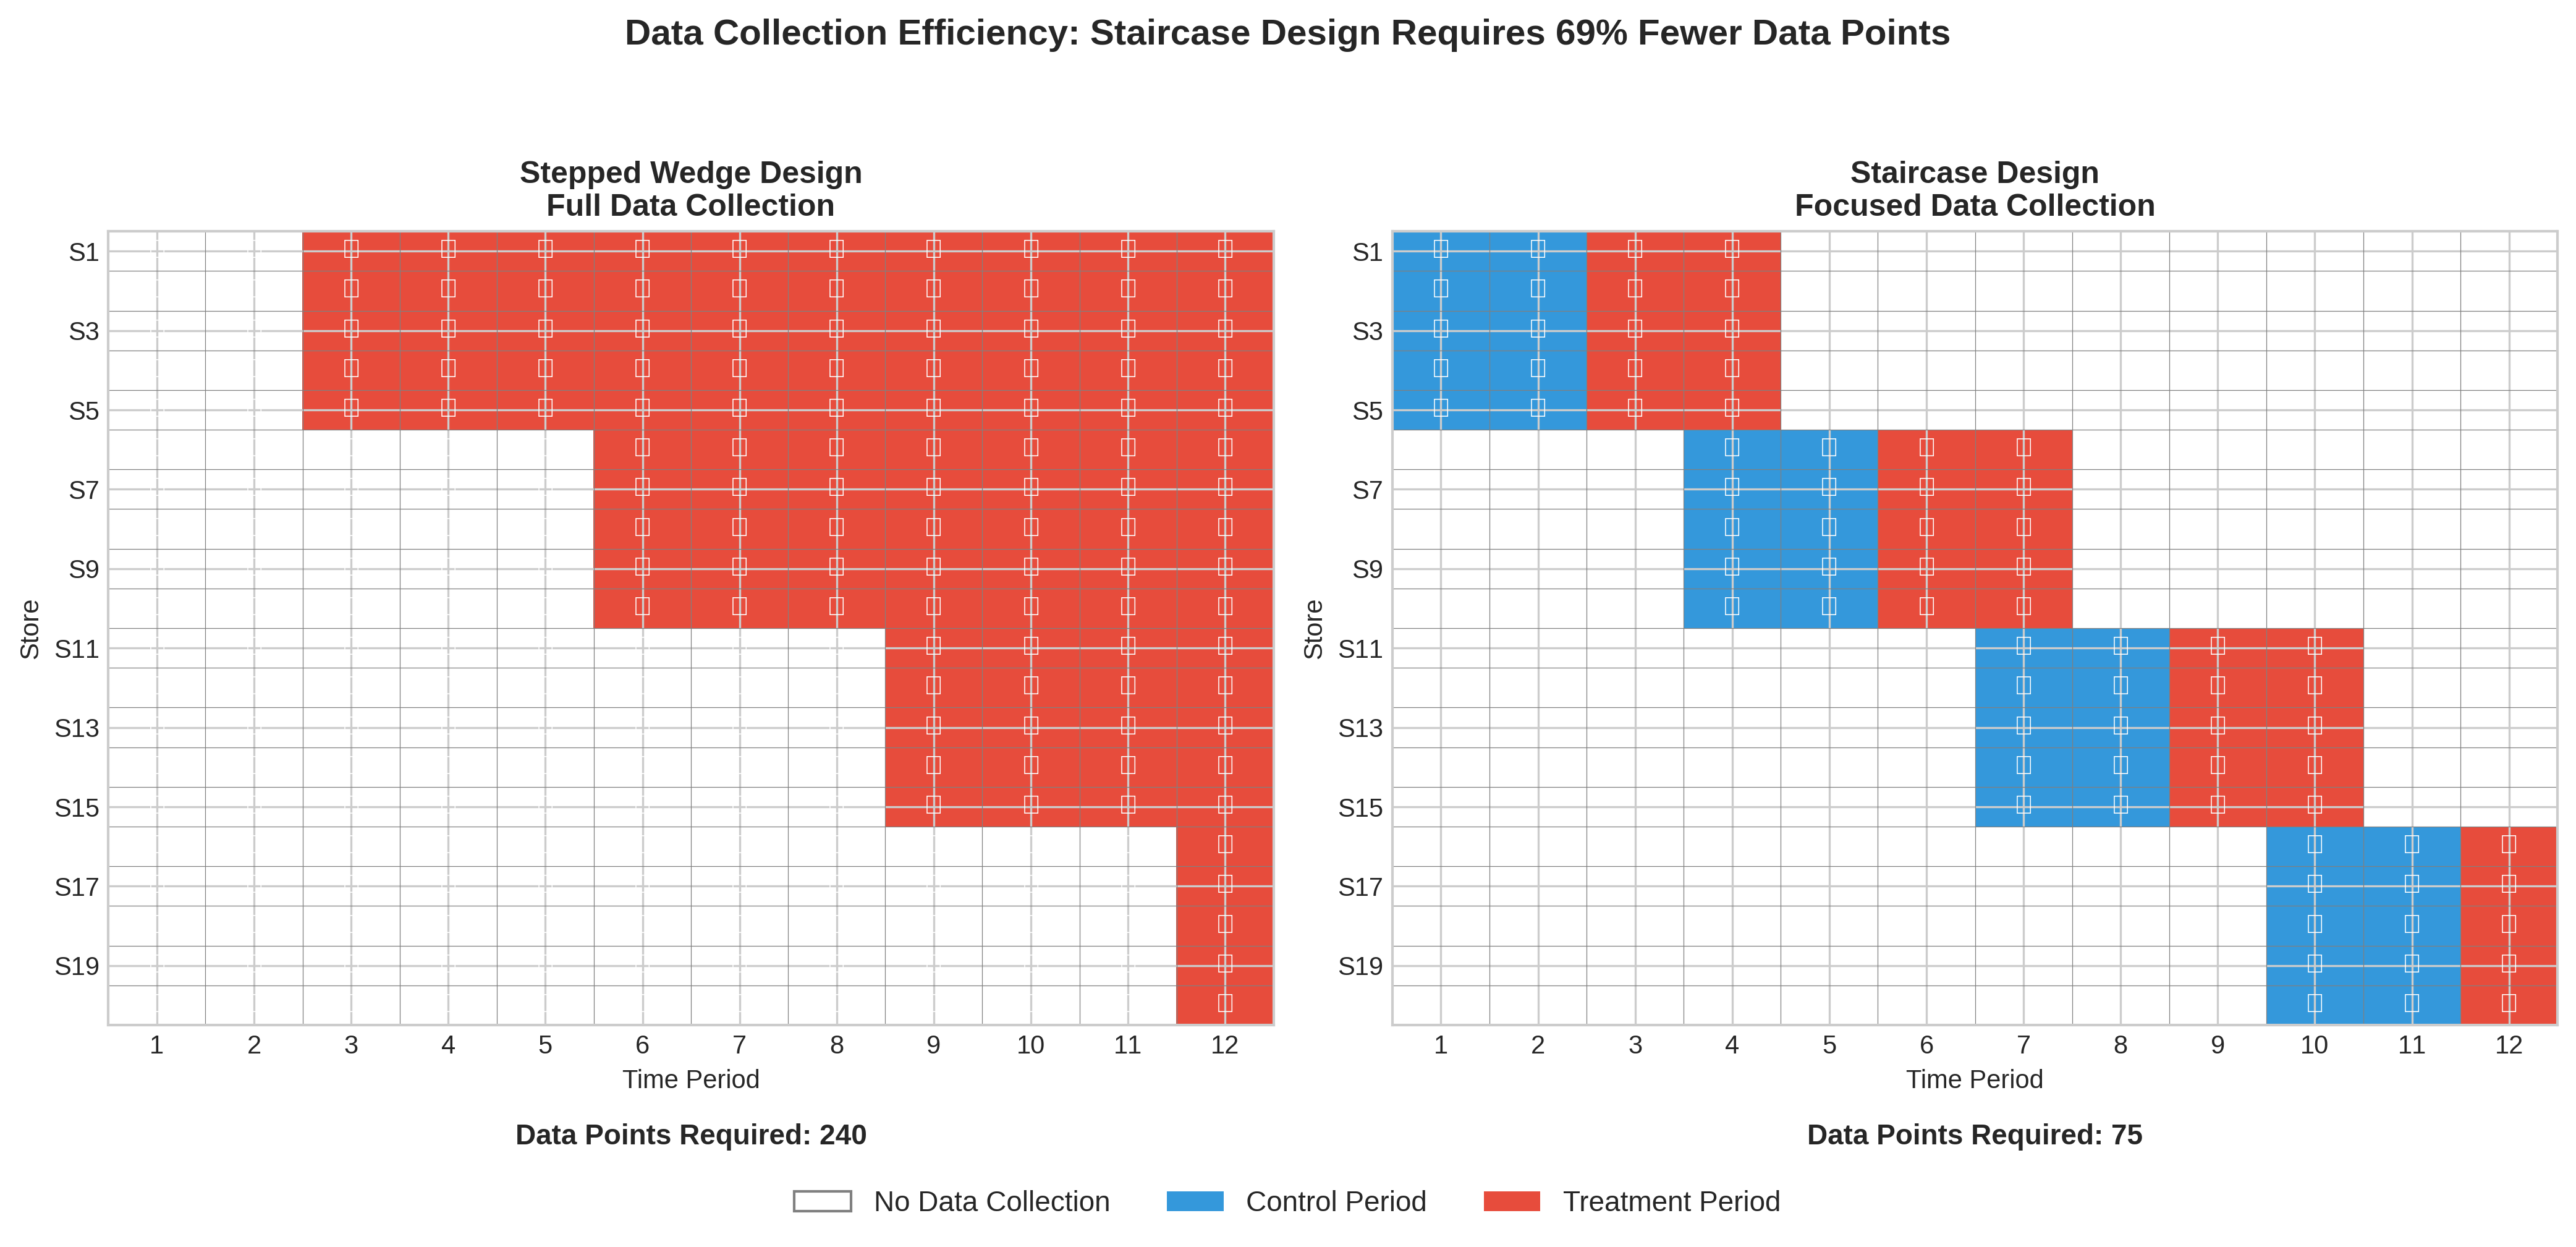
The Problem with SWT: A full SWT requires data collection from every cluster during every single time period, which can be expensive and burdensome
The Staircase Solution: Each cluster only provides data for a limited number of periods just before and just after it “steps” into treatment
This focuses data collection on the most statistically valuable periods, significantly reducing operational cost without major loss of power. GeoStep is the first marketing analytics library to formally implement this cutting-edge design.
Key Benefits:
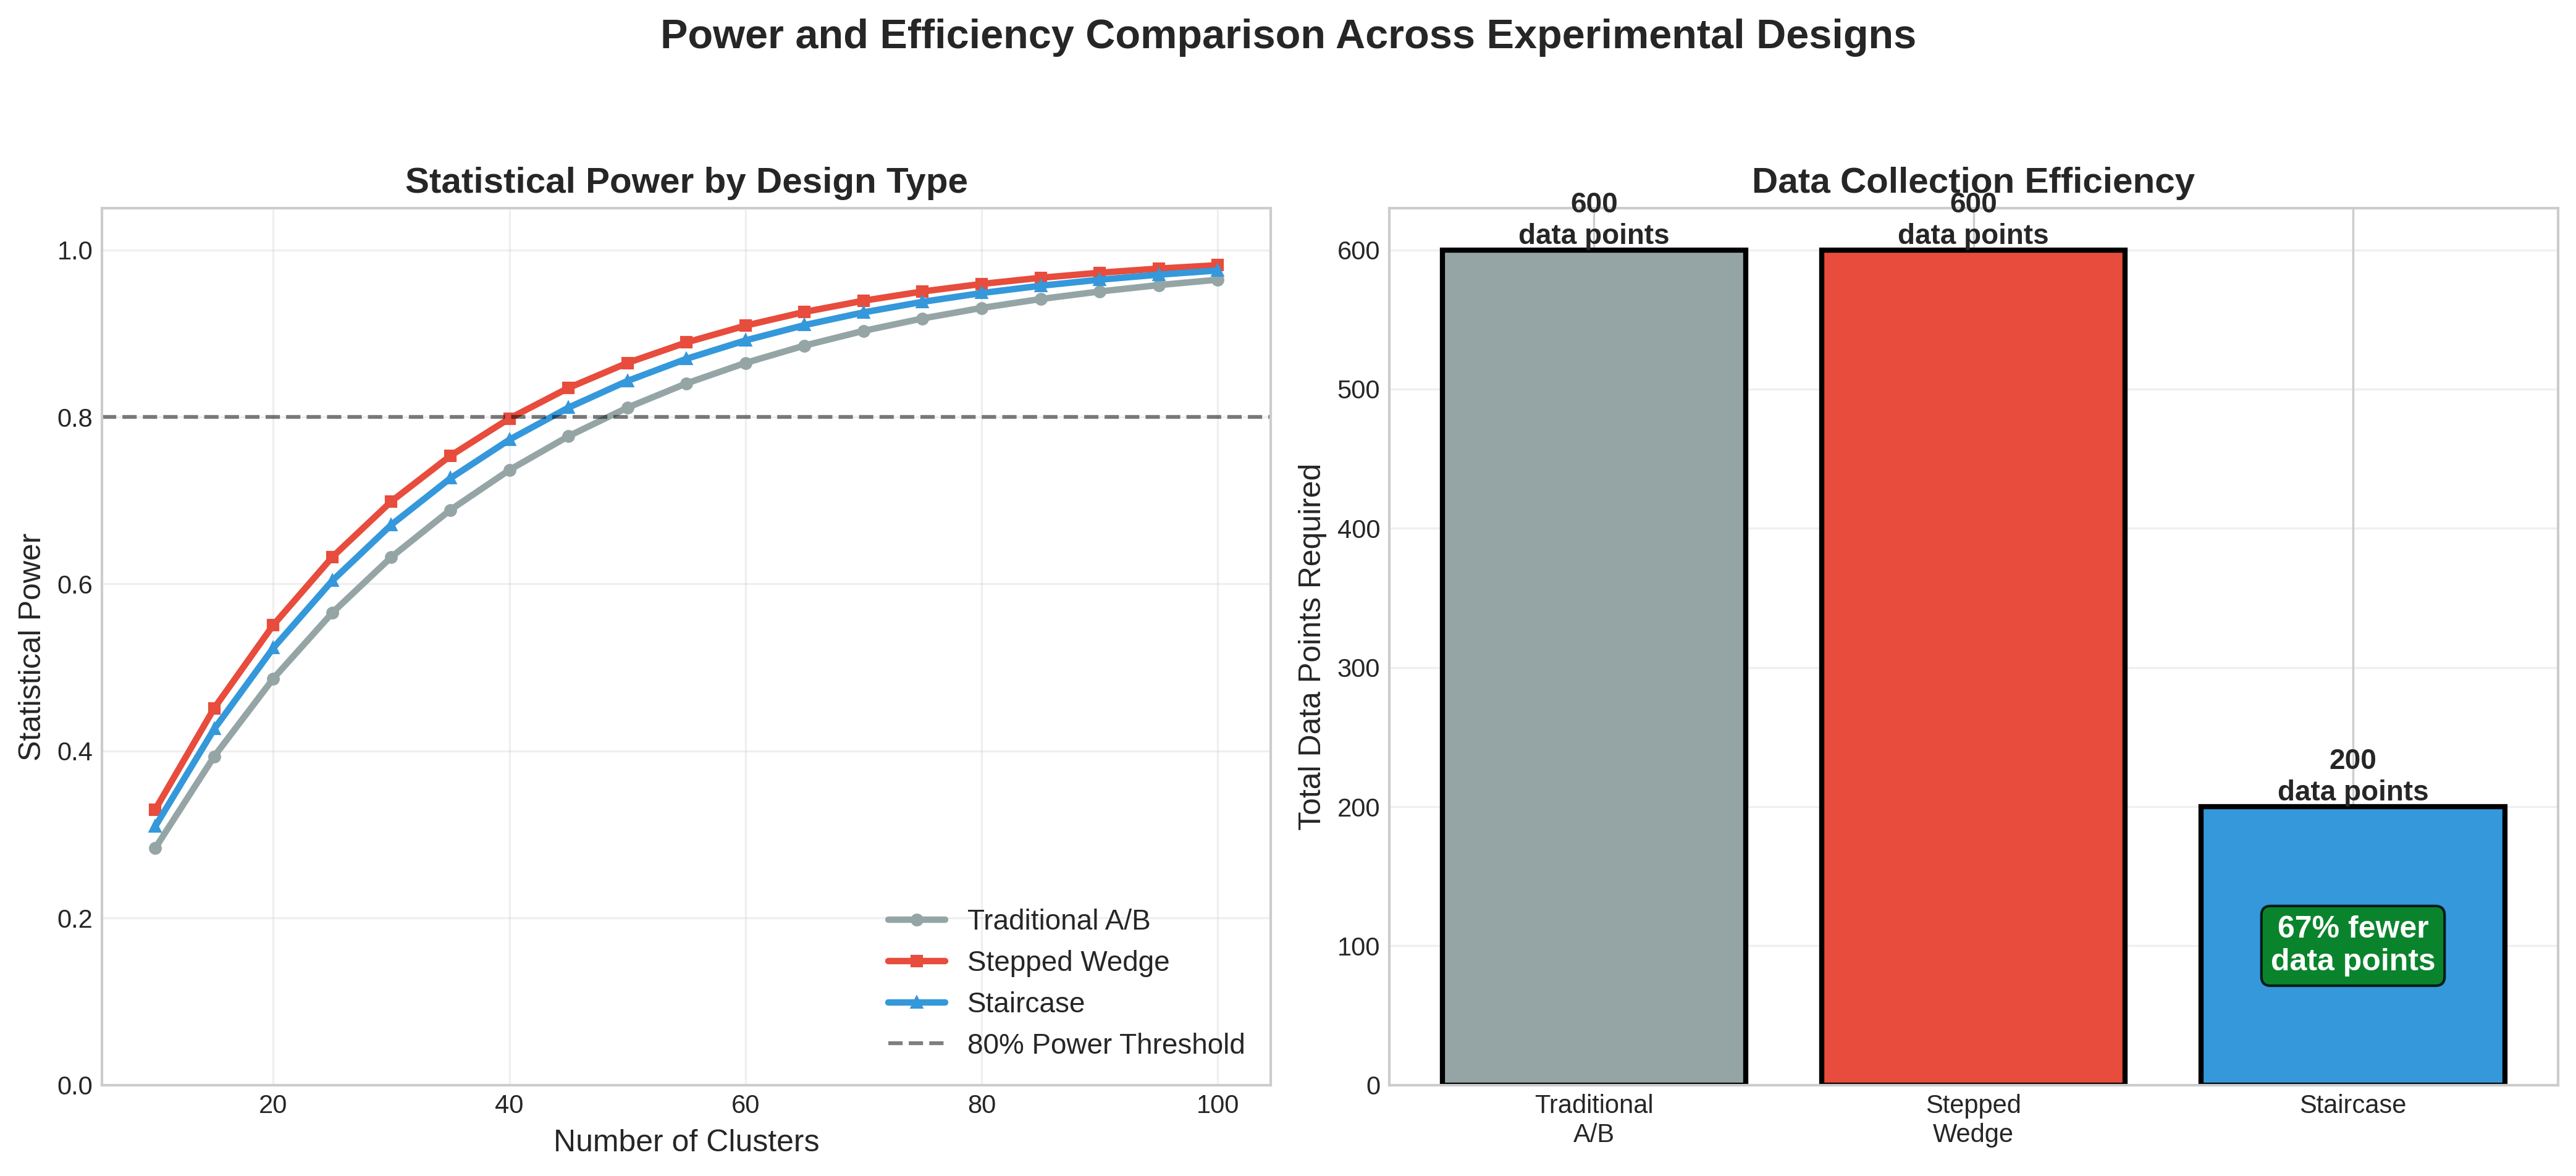
40-60% reduction in data collection requirements
Minimal power loss (<10% in most scenarios)
Flexible implementation across different business contexts
Core Analysis Methods
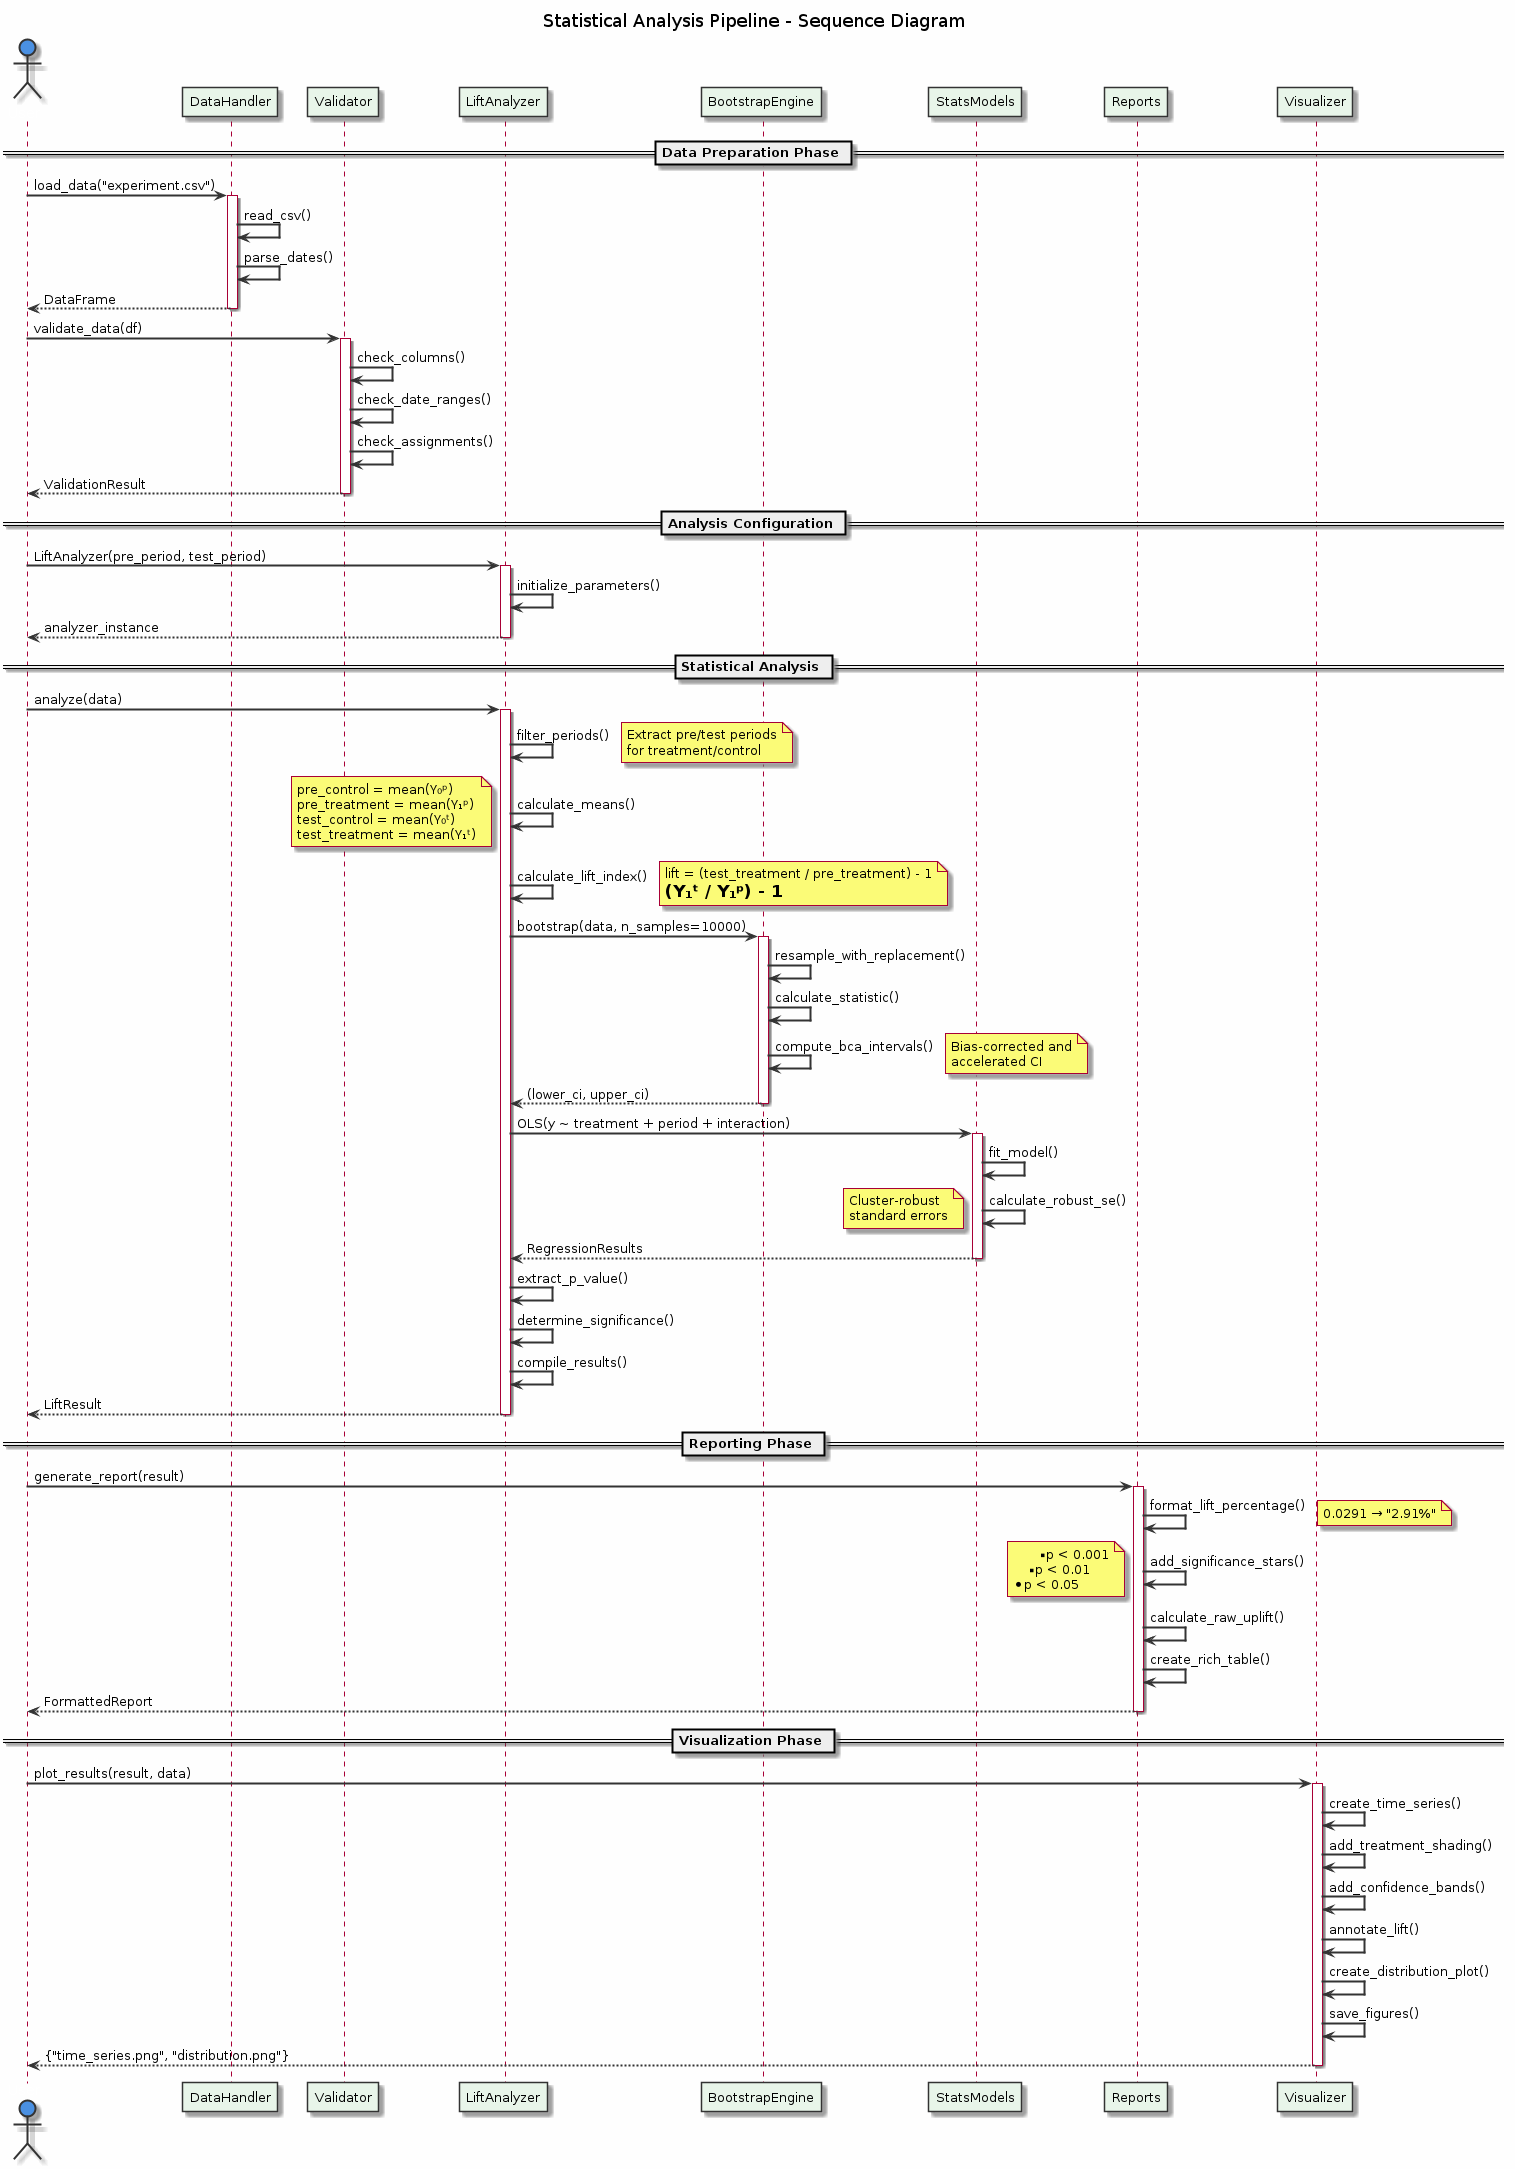 Figure: The complete statistical analysis pipeline showing data flow from raw inputs through validation, analysis, and reporting. The sequence diagram illustrates how different components interact to produce robust experimental results.
1. Normalized Lift Index Method (Primary)
The primary analysis method used in GeoStep is based on a t-test on normalised values:
Baseline Calculation: For each geographic unit, calculate its average performance during the pre-test period
Projection: Use this to project what performance would have been during the test period without intervention
Lift Index: Calculate the percentage difference between actual and projected performance:
Lift Index = (Actual Test Period / Projected Test Period) - 1
Statistical Test: Use a t-test with cluster-robust standard errors to test if treatment lift differs from control
Why Normalization Works:
Accounts for Size Differences: Large and small geos are compared fairly
Controls for Trends: Pre-period performance captures underlying trends
Robust to Outliers: Percentage changes are less sensitive to extreme values
2. Difference-in-Differences (DiD) Analysis
As a robustness check, GeoStep also implements DiD analysis:
Treatment Effect = (Treatment_Post - Treatment_Pre) - (Control_Post - Control_Pre)
This double-differencing removes:
Time-invariant differences between treatment and control
Common time trends affecting both groups
3. Cluster Randomized Trial (CRT) Analysis
For stepped-wedge and staircase designs, we use mixed-effects models:
Fixed Effects: Time periods and treatment status
Random Effects: Geographic clusters
Cluster-Robust SEs: Account for within-cluster correlation
Statistical Interpretation
Understanding Effect Sizes
GeoStep reports multiple measures of effect:
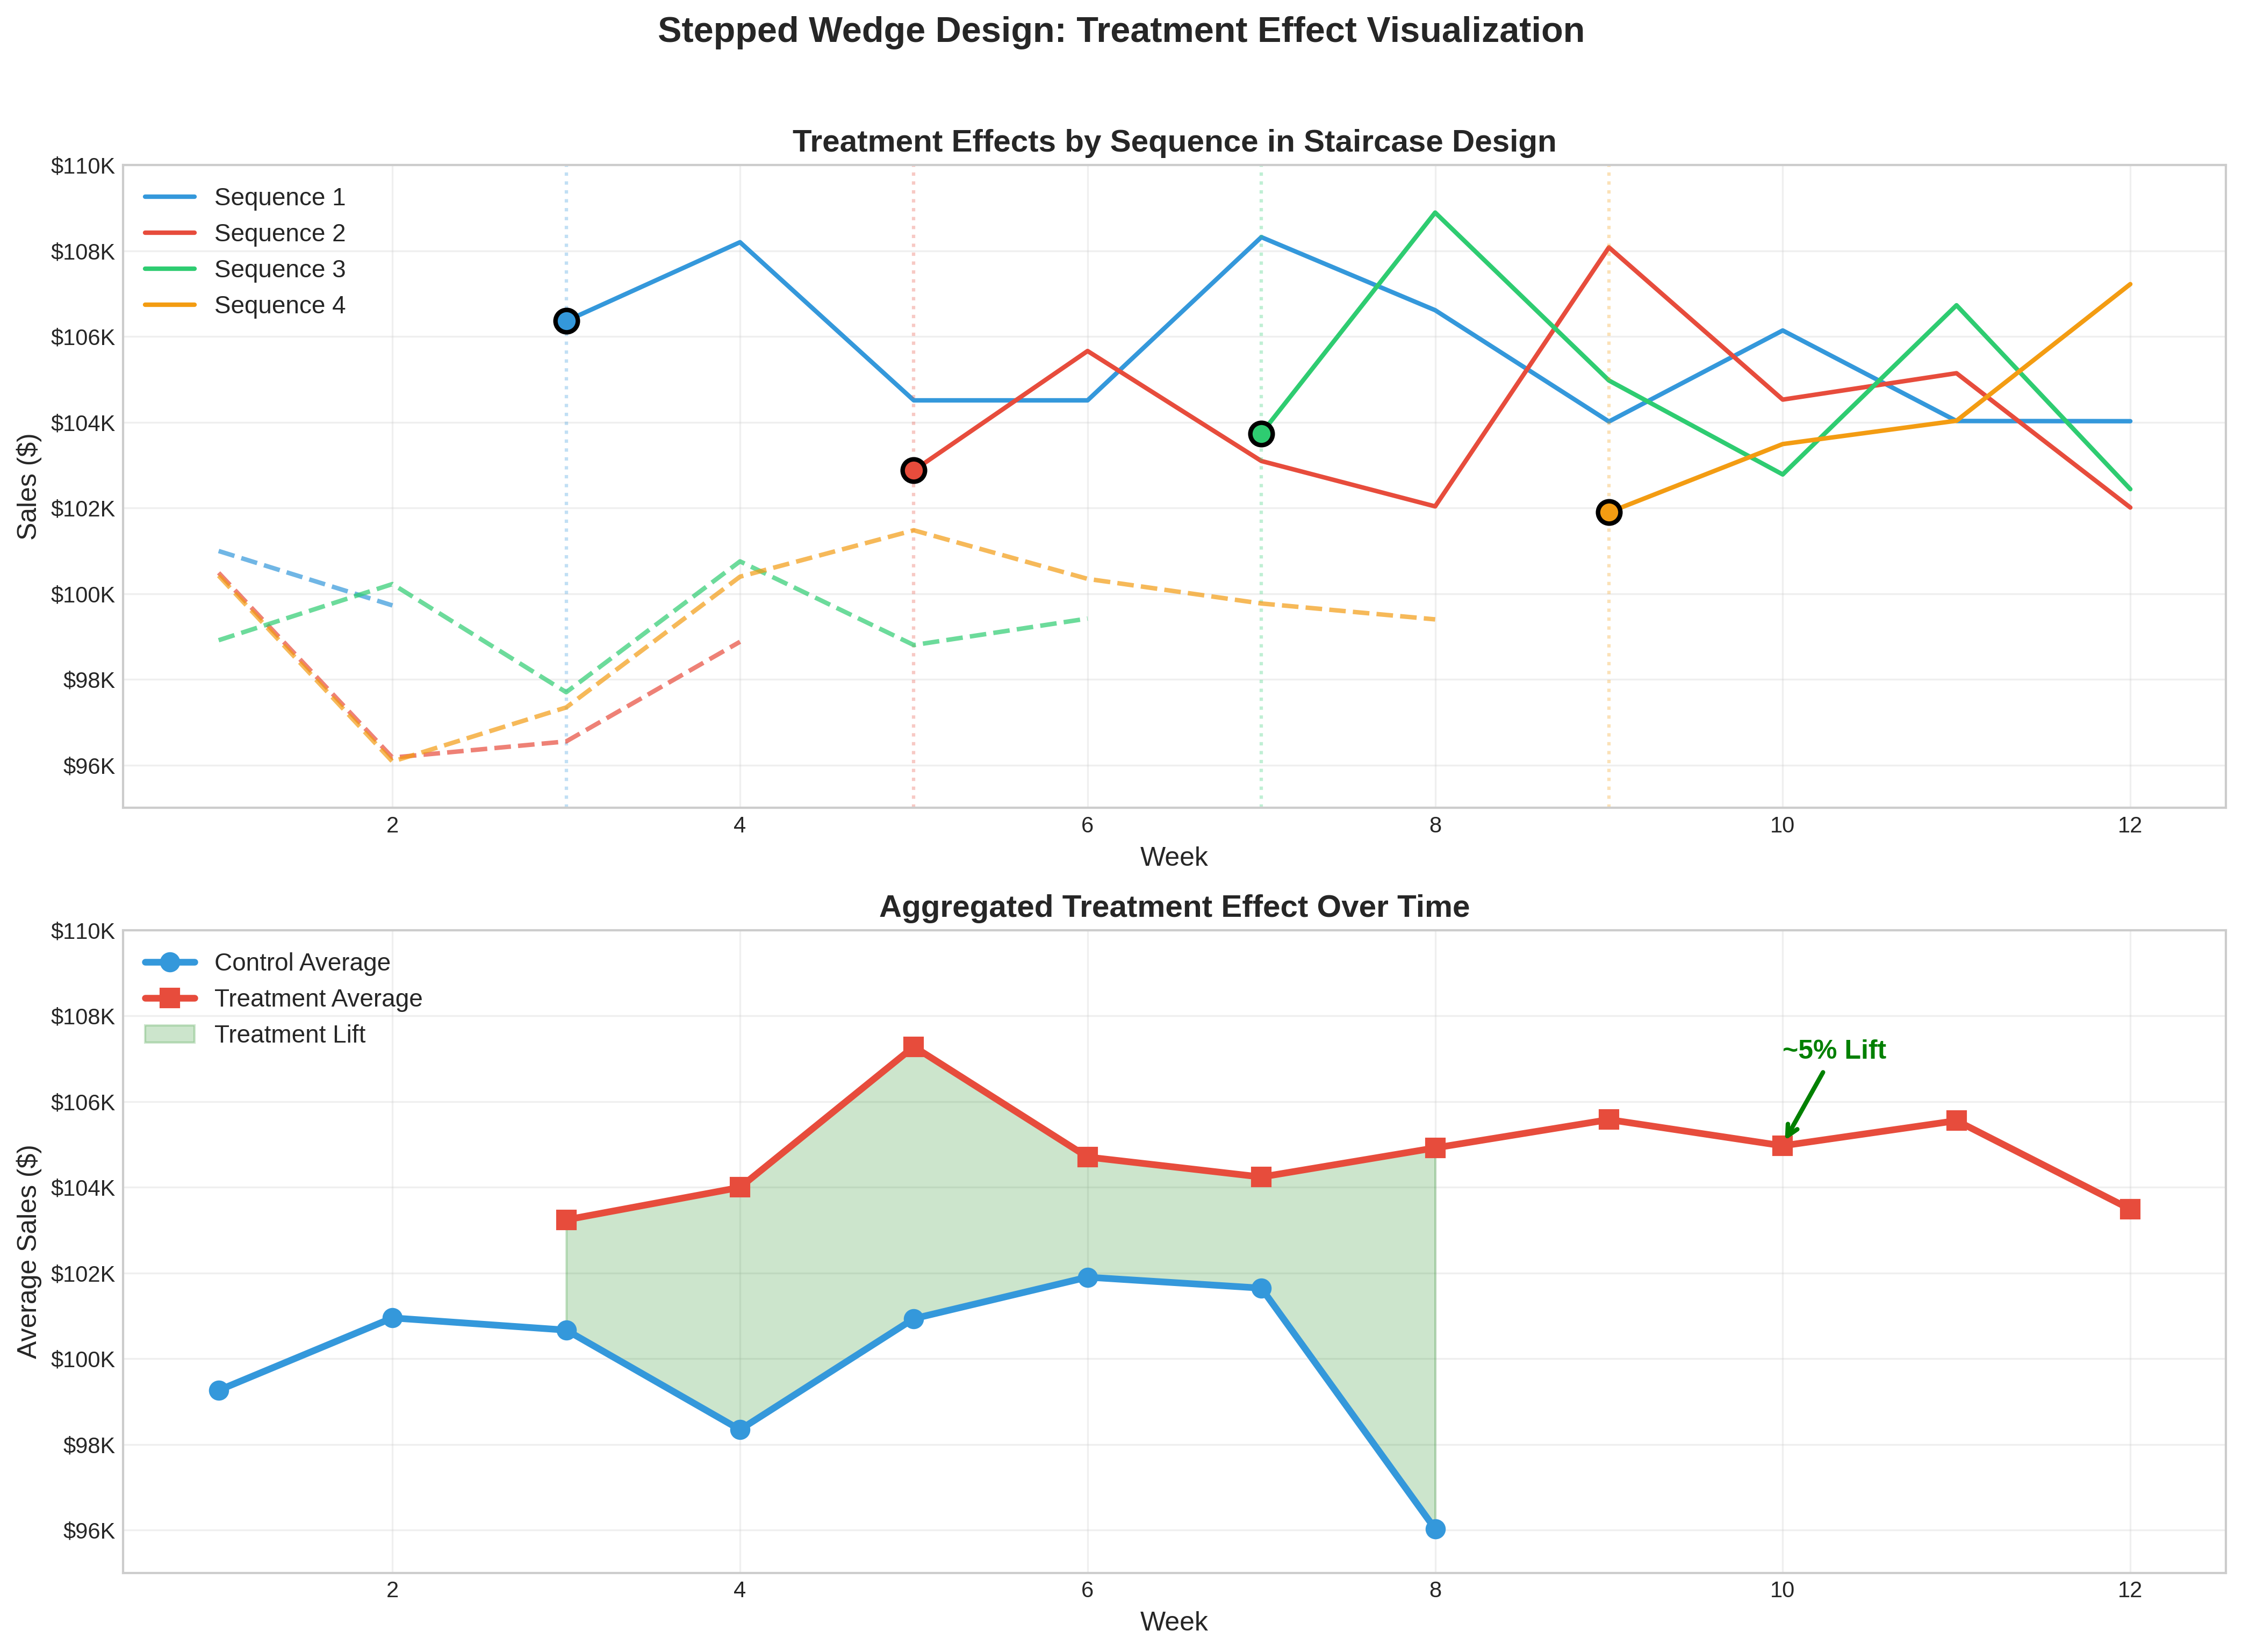
Lift Percentage: The relative increase (e.g., 2.91% lift)
Raw Volume Uplift: The absolute increase (e.g., 558 additional units)
Cohen’s d: Standardized effect size for meta-analysis
Hedges’ g: Bias-corrected standardized effect size
Significance Levels
Results include clear significance indicators:
P-Value Range |
Indicator |
Interpretation |
|---|---|---|
p < 0.001 |
|
Highly significant |
p < 0.01 |
|
Very significant |
p < 0.05 |
|
Significant |
p ≥ 0.05 |
(not significant) |
No evidence of effect |
Confidence Intervals
We provide 95% confidence intervals by default:
Interpretation: We are 95% confident the true effect lies within this range
Practical Use: If CI excludes zero, the effect is statistically significant
Business Impact: Use the lower bound for conservative planning
Power Analysis Methodology
Determining Sample Size
Power analysis helps determine how many geographic units and how long to run your test:
Key factors affecting power:
Effect Size: Larger effects are easier to detect
Sample Size: More geos increase power
Variance: Lower variance increases power
Test Duration: Longer tests capture more data
Significance Level: Standard is α = 0.05
Minimum Detectable Effect (MDE)
The MDE is the smallest effect your test can reliably detect:
MDE ≈ 2.8 × (σ / √n) × √(1 + ρ(m-1))
Where:
σ = standard deviation of the outcome
n = number of geographic units
ρ = intra-cluster correlation
m = number of time periods per cluster
Design Comparison
Design |
Best For |
Power |
Cost |
Complexity |
|---|---|---|---|---|
Simple RCT |
Quick tests, abundant data |
Medium |
Low |
Low |
Stratified RCT |
Heterogeneous markets |
High |
Low |
Medium |
Stepped-Wedge |
Phased rollouts |
High |
High |
High |
Staircase |
Efficient phased rollouts |
High |
Medium |
High |
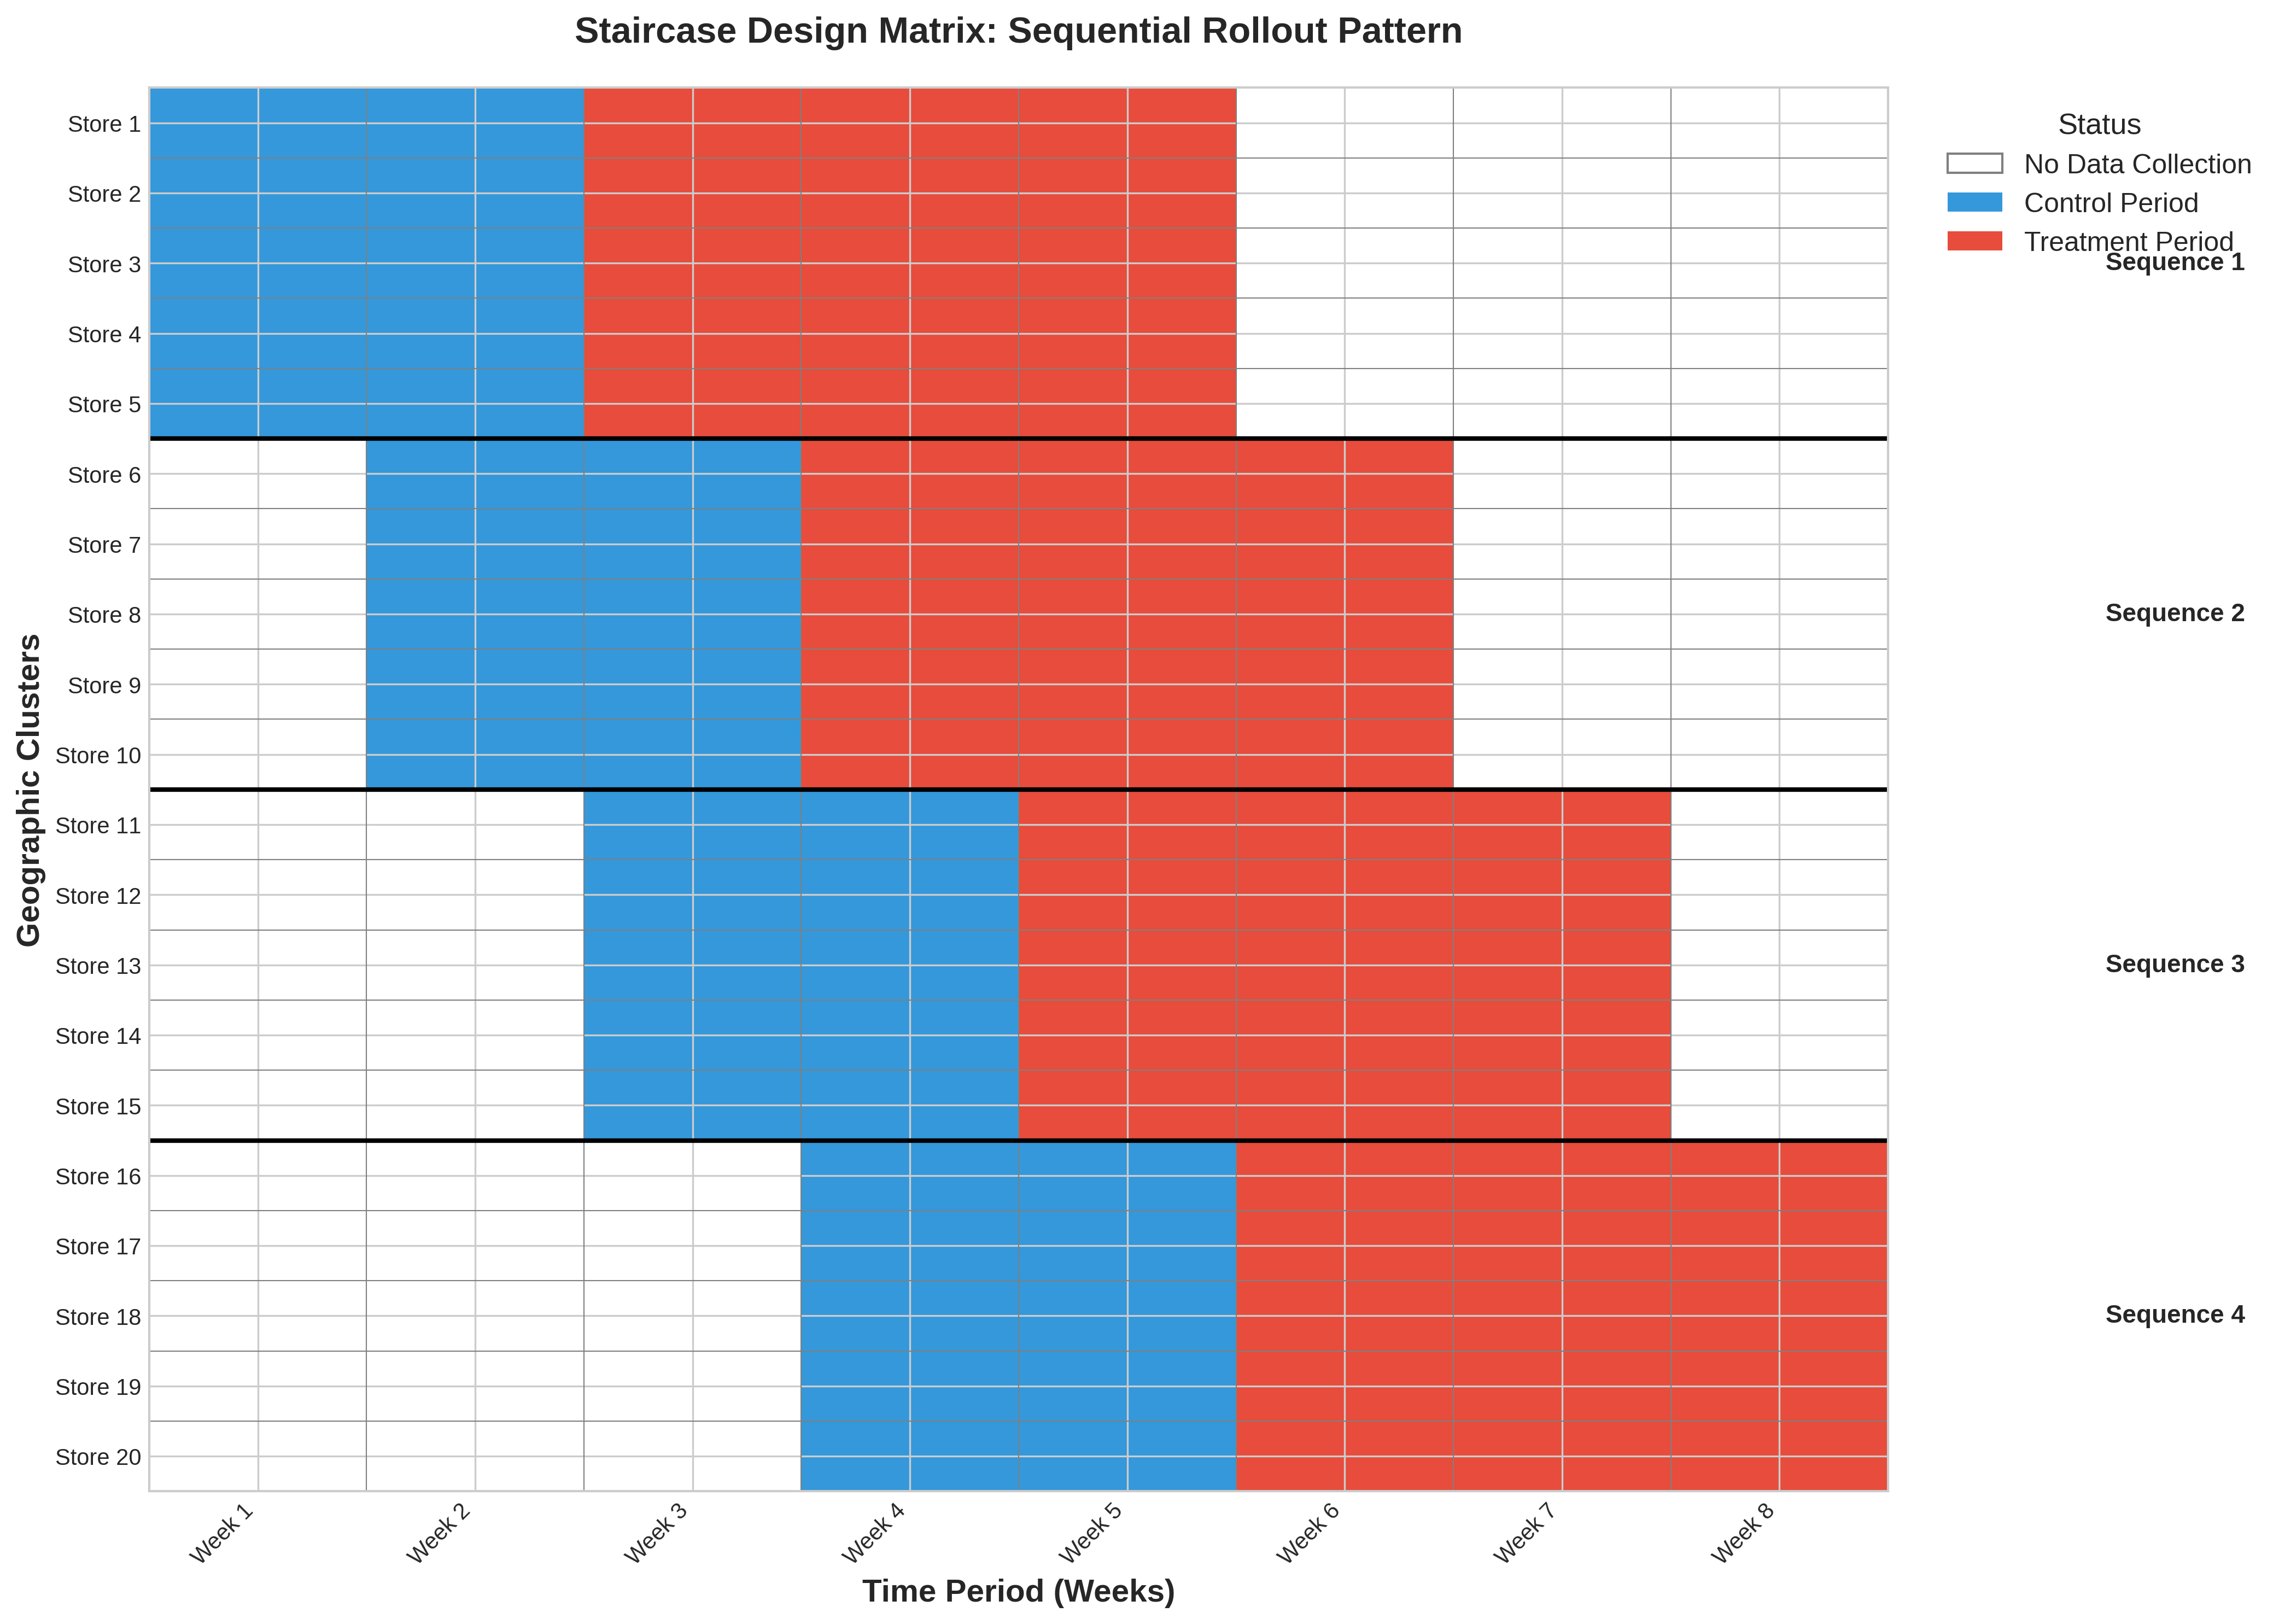
Data Collection Efficiency
The chart above shows how different designs compare in terms of data requirements:
Simple RCT: Requires continuous data for all units
Stepped-Wedge: Full data matrix needed
Staircase: Only collects data around transition periods (40-60% reduction)
Advanced Topics
1. Spillover Effects
Geographic experiments can suffer from spillover (treatment affecting control units):
Detection: Compare border vs. interior control units
Mitigation: Use buffer zones or larger geographic units
Analysis: Spatial econometric models
2. Heterogeneous Treatment Effects
Treatment effects may vary across segments:
Analysis: Interaction terms in regression models
Visualization: Subgroup forest plots
Interpretation: Consider operational feasibility of targeting
3. Multiple Testing Corrections
When testing multiple hypotheses:
Bonferroni Correction: Conservative, controls family-wise error rate
Benjamini-Hochberg: Less conservative, controls false discovery rate
Pre-registration: Specify primary vs. secondary outcomes
4. Bayesian Methods
For advanced users, Bayesian approaches offer:
Prior Information: Incorporate historical data
Probabilistic Statements: “95% probability the lift is between 2-4%”
Decision Theory: Optimize decisions under uncertainty
Best Practices
1. Pre-Test Planning
Define primary KPI and success criteria
Run power analysis to determine sample size
Document analysis plan before seeing results
2. Randomization Quality
Check balance on observable covariates
Use stratification for important variables
Document randomization procedure
3. Data Quality
Monitor data completeness throughout test
Check for anomalies or data issues
Validate treatment delivery
4. Analysis Rigor
Run primary analysis as pre-specified
Conduct robustness checks (DiD, sensitivity)
Report all results, not just significant ones
5. Business Integration
Translate statistical significance to business impact
Consider practical significance vs. statistical significance
Document lessons learned for future tests
References
Grantham, K. L., et al. (2024). “The Staircase Design: A more efficient alternative to the stepped wedge design.” Contemporary Clinical Trials.
Hussey, M. A., & Hughes, J. P. (2007). “Design and analysis of stepped wedge cluster randomized trials.” Contemporary Clinical Trials.
Vaver, J., & Koehler, J. (2011). “Measuring ad effectiveness using geo experiments.” Google Research.
Bojinov, I., & Shephard, N. (2019). “Time series experiments and causal estimands: exact randomization tests and trading.” Journal of the American Statistical Association.
Next Steps
Getting Started: Practical implementation guide
API Reference: Detailed function documentation
Business Guide: ROI and integration strategies